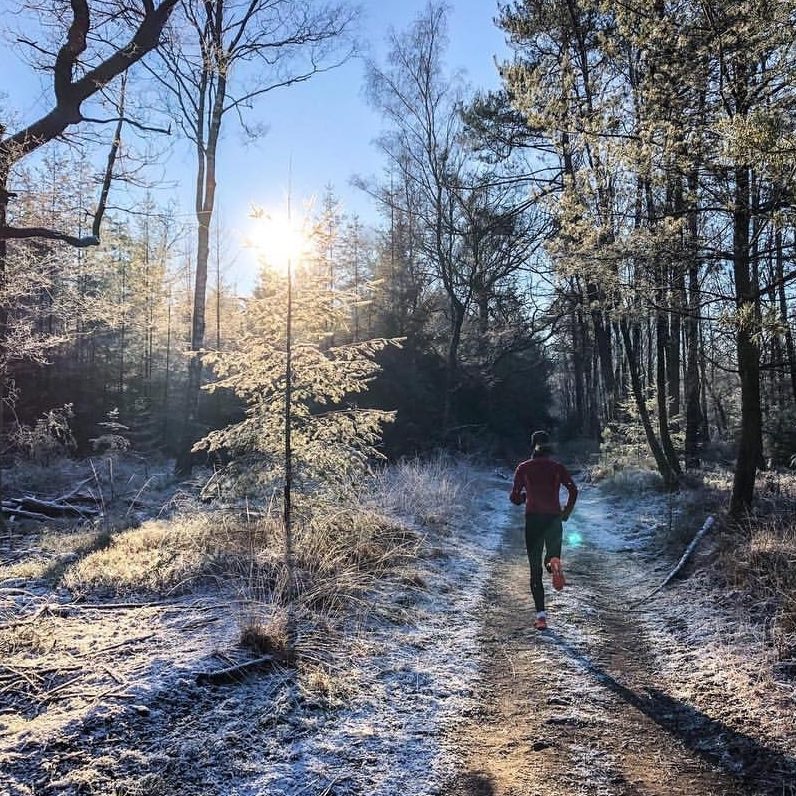
If you went running or cycling in 2018 there's a good chance you're one of the 36 million people who used Strava - one of the best fitness tracking (and stalking) applications available.
A few months ago, Strava released its annual "Year In Sport" report detailing the exercise trends of its users across the globe with some interesting results.
It's no surprise that both running and cycling dominated the Strava landscape and here's what they found from all data they collected in 2018.
We Love Running and Cycling
Users logged over 280 million rides and 240 million runs. Interestingly, the average distance per ride globally was almost 22 mi (35 km) compared to 5 mi (8 km) running. This could just be me but those numbers are a little higher than my averages! That's a lot of chafed behinds and pavements pounded.
The Most Popular Running Segment Is in Brooklyn
Segments are perhaps the pillar of Strava's appeal. For those unaware, they are interesting sections of a particular route created by the user/s. And they rock. The chance to have a virtual race against yourself or literally anyone else who has ever completed and logged the same segment is fantastic.
From a running perspective Prospect Park in Brooklyn, New York, America has the title of 2018's most attempted segment. The Prospect Park 5k - North Start had a whopping 98,503 attempts recorded. This is one I'd love to have a go at.

Cyclists Love Dorking
In terms of cycling, Dorking in the UK was the most used segment with 492,520 attempts made. Although relatively short (1.5 miles) it's nice to see there's some elevation involved (436 ft).

We Make Extra Time For Extra Activity
For those who love to do more than one activity, we won't do it at the expense of something else. We find extra time to do it. We average approximately 6.5 individual activity uploads to Strava per month. However, this jumps up to over 15 per month when another one or more is added. This is great to hear.
Older Means Longer
Interestingly it seems that those 50 years old and above dominated the distance charts for both men and women on the bike. I find it really impressive that those 70 years and above are riding more miles/km than those 39 years and below. This may cater to those no longer in the workforce or whose families are a little older, but it's amazing nonetheless.
Longer average running distances seem skewed more to those between 30-60 years of age for both genders. Does this slight trend towards a younger population reflect the relative difference in impact between activities?
We Love To Go Hard
For comparison (and inspiration), check out these speed numbers.
The average riding speed (all ages) for women was 12.1 mph (19.5 km/h) and men 13.7 mph (22 km/h). The average time to run a mile was 10:40 (06:37 per km) for the ladies and 09:15 (05:54 per km) for the guys.
Tuesdays Are the Fastest
How's this for an interesting statistic. On average Tuesday was the fastest day to go for a run yet the slowest day on the bike. Even more amazing is that Sunday happens to be the slowest day for a jog yet the fastest day for a ride. I can imagine that traffic plays a role in dictating the daily speed averages on the bike - especially considering Saturday comes in at number two, but what could explain Tuesday's numbers on speed for both activities?
We Go Indoors On Tuesday
To keep our fascination with Tuesdays going it seems that it's also our favorite day for an indoor workout. These numbers understandably regress as the weekend approaches but it's interesting to note that four of the five busiest days were Tuesdays. Encouragingly the five lowest days were logged over the weekend.
We Like a Reward
Heading out for a ride and coffee is a cliche but one seemingly supported by the stats. Strava found cyclists five times more likely (491,000 mentions) to associate a coffee with their workout compared to runners (86,000).
Cycling certainly lives up to its name as a social pursuit. Athletes associated cakes, cookies, donuts and pastries at least twice as much with their workouts when compared to runners. Is this the reason we logged more time and distance on the bike in 2018? Those treats won't work themselves off, am I right!?
This also goes for our mate, good ol' beer. Beer had the greatest total association to exercise with over 650,000 mentions - far exceeding the rest.
How do these numbers compare to your own Strava data?
Let me know in the comments below!

